Other functionalities of the package
The molecularprofiles package comes with a set of functions that may be useful to interact with the meteorological data for the CTA.
In order to load them one needs to import these functions within a Python interpreter:
> from molecularprofiles.utils.dataframe_ops import *
This will load all the functions contained within the dataframe_ops.py script.
For instance, once we have successfully loaded some data using the steps described in the MolecularProfile class.
Once we have loaded the data we can start interacting with the dataframe that is created and, for instance, use a function to plot a wind-rose graphic of the direction and speed of the wind. In order to do this plot we can simply do:
> ecmwf = MolecularProfile('input_grib_file.grb', data_server='ECMWF', observatory='north')
> ecmwf.get_data()
> dfw = create_wind_speed_dataframe(ecmwf.dataframe)
> plot_wind_rose(dfw)
The result of these actions will be a plot, that is saved into the working directory, similar to this:
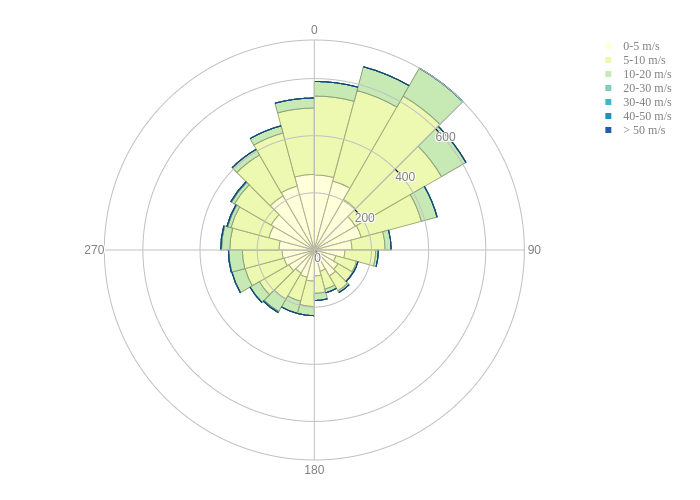
In this plot, the radial axis represent the number of occurrences and the angular axis represents the direction of the wind. If the user filters the data by altitude, for instance, another plot can be made counting only the data at this particular altitude. It applies to any kind of filter that the user may apply within the ecmwf.get_data() method. See the MolecularProfile class. for more information about filtering the data.